I Built My Own Portainer — Plus Agents — in a Single Day With AI
My homelab is one Proxmox host, one Docker host and a growing pile of containers: a few services I build myself, a lot of public images, static sites, a database cluster. Portainer showed me containers, but it knew nothing about my setup — which hostname is public and which is LAN-only, which container belongs to which Git repo, when something was last deployed, whether a backend is even needed right now.
So I built the dashboard I actually wanted. The first commit landed at noon; by the evening it was running in production, with about 6,700 lines of JavaScript, CSS and HTML, 26 tests and no database. I wrote almost none of that code myself — I described outcomes, the AI built and verified them, and several AI agents worked in parallel. This post is about what came out, how the work went, and what went wrong on the way. (All screenshots are from a demo mode with invented data — none of my real apps are in them.)
What it does
A dashboard that knows the host. CPU, memory, disks (fast and slow), GPU, and everything that crashed in the last 24 hours — in one glance, updating live.
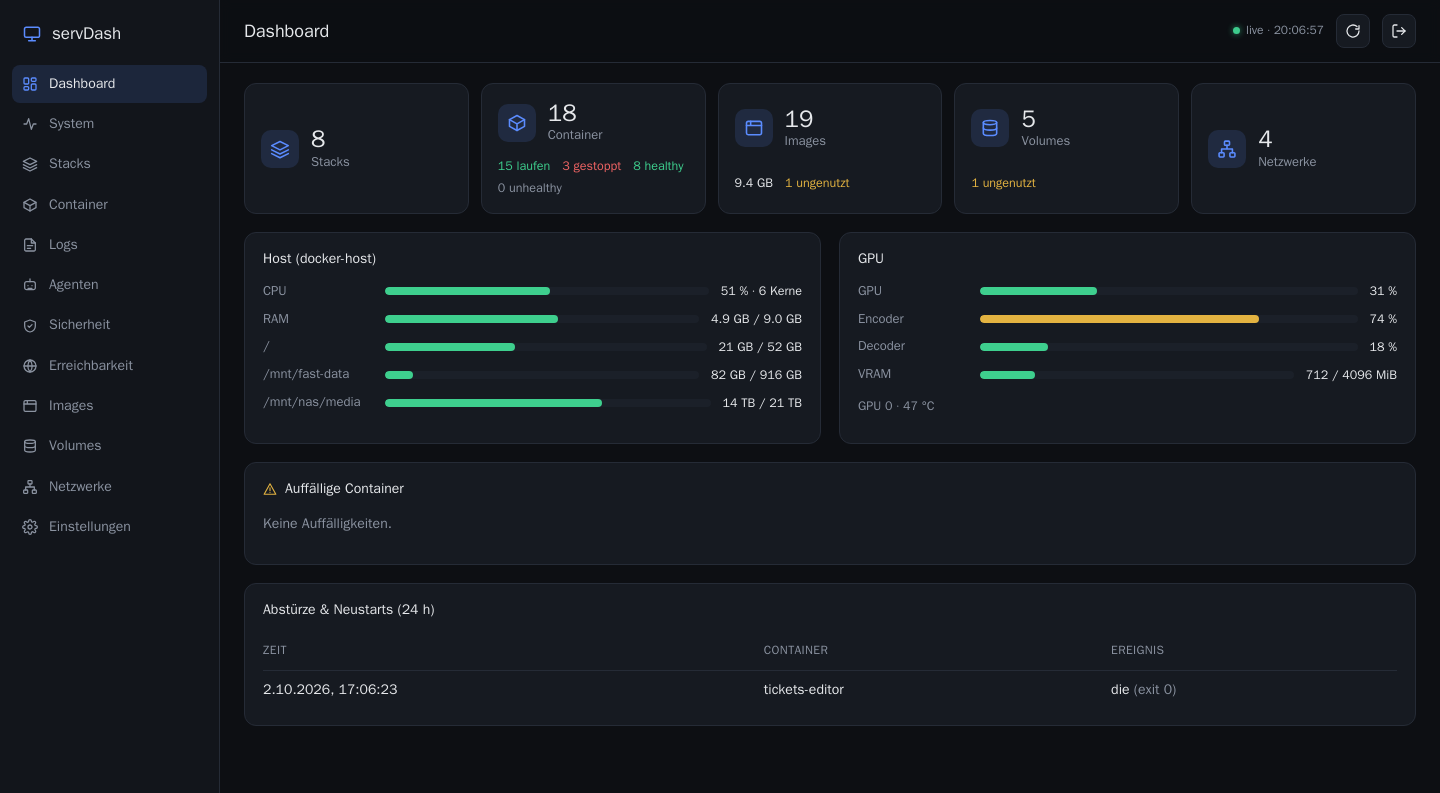
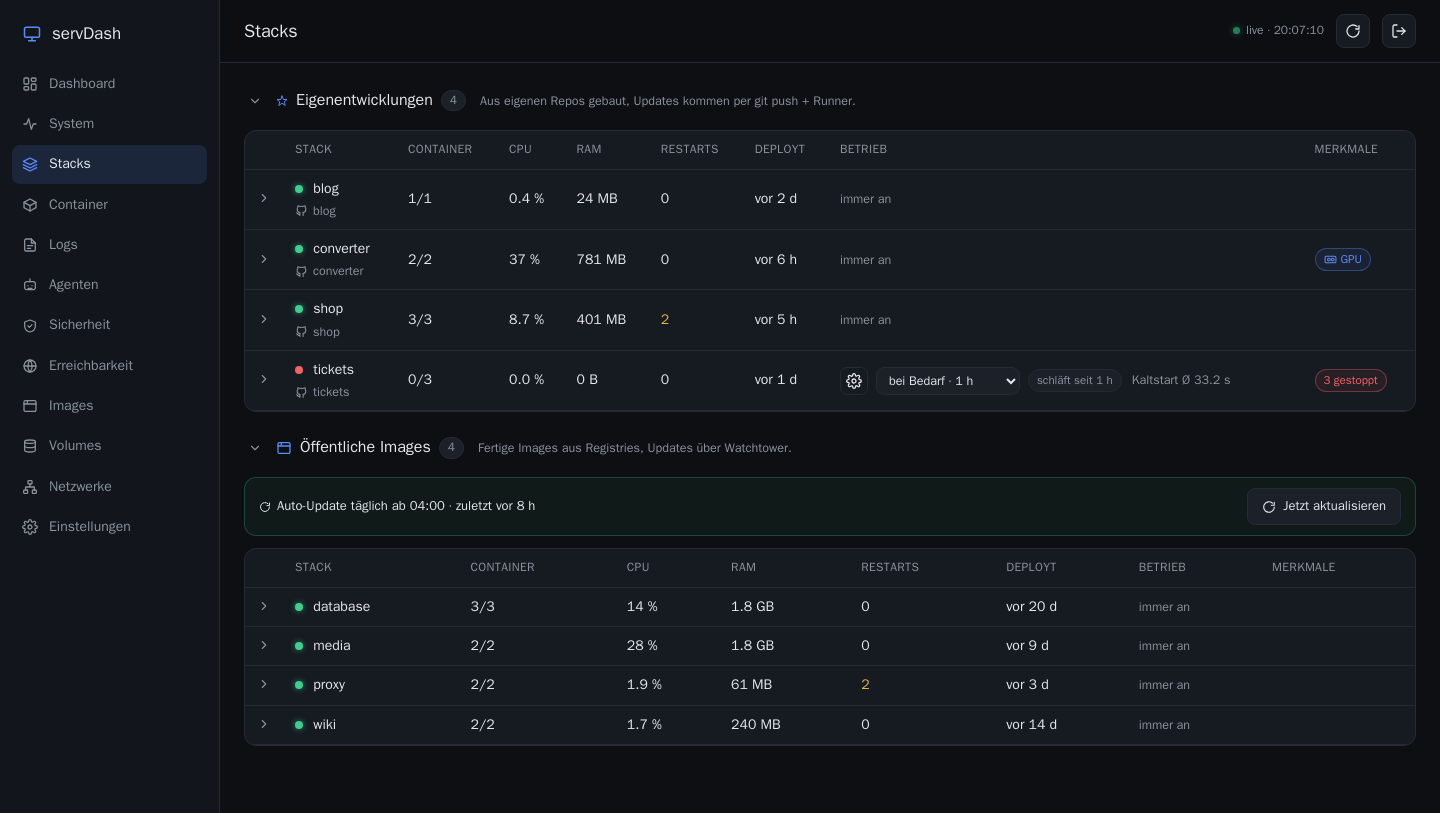
Stacks and containers, sorted by how they are maintained. Things I build myself are separated from public images. Public images get a per-image auto-update switch (a nightly job asks Watchtower to update exactly the images I enabled). Every stack links to its Git repo and shows when it was last deployed. Start, stop, restart and a 48-hour log viewer with export are one click away.
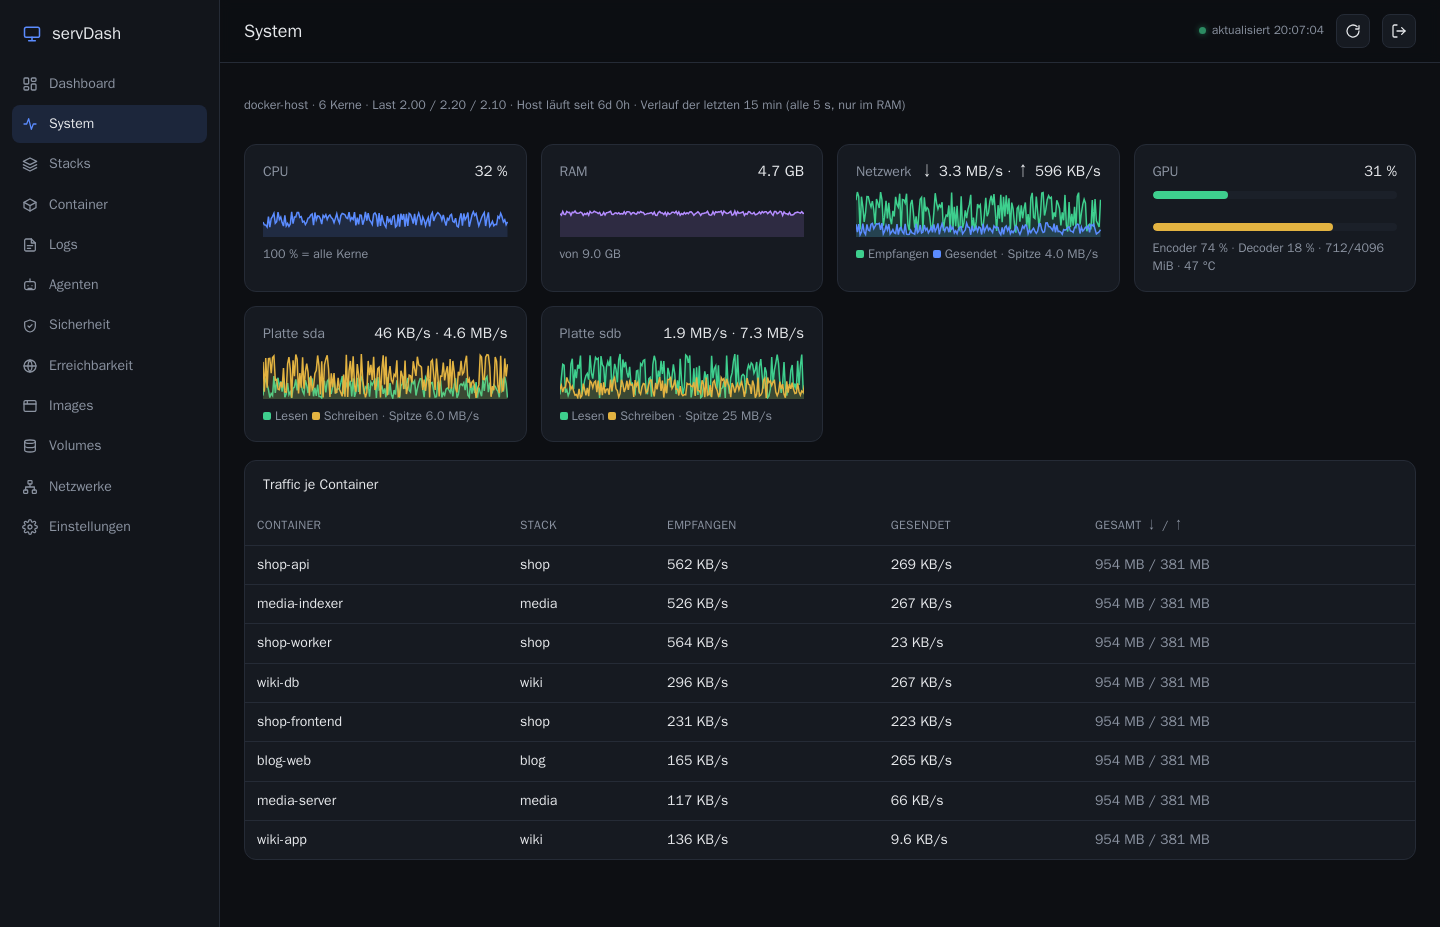
Real-time numbers without paying for them. The obvious way to get per-container CPU and memory is docker stats, and it is surprisingly expensive: each call takes one to two seconds per container and keeps the Docker daemon busy. The dashboard reads the cgroup counters straight from the filesystem instead — a handful of tiny file reads per container — and pushes updates to the browser every two seconds over Server-Sent Events, but only while somebody is actually watching.
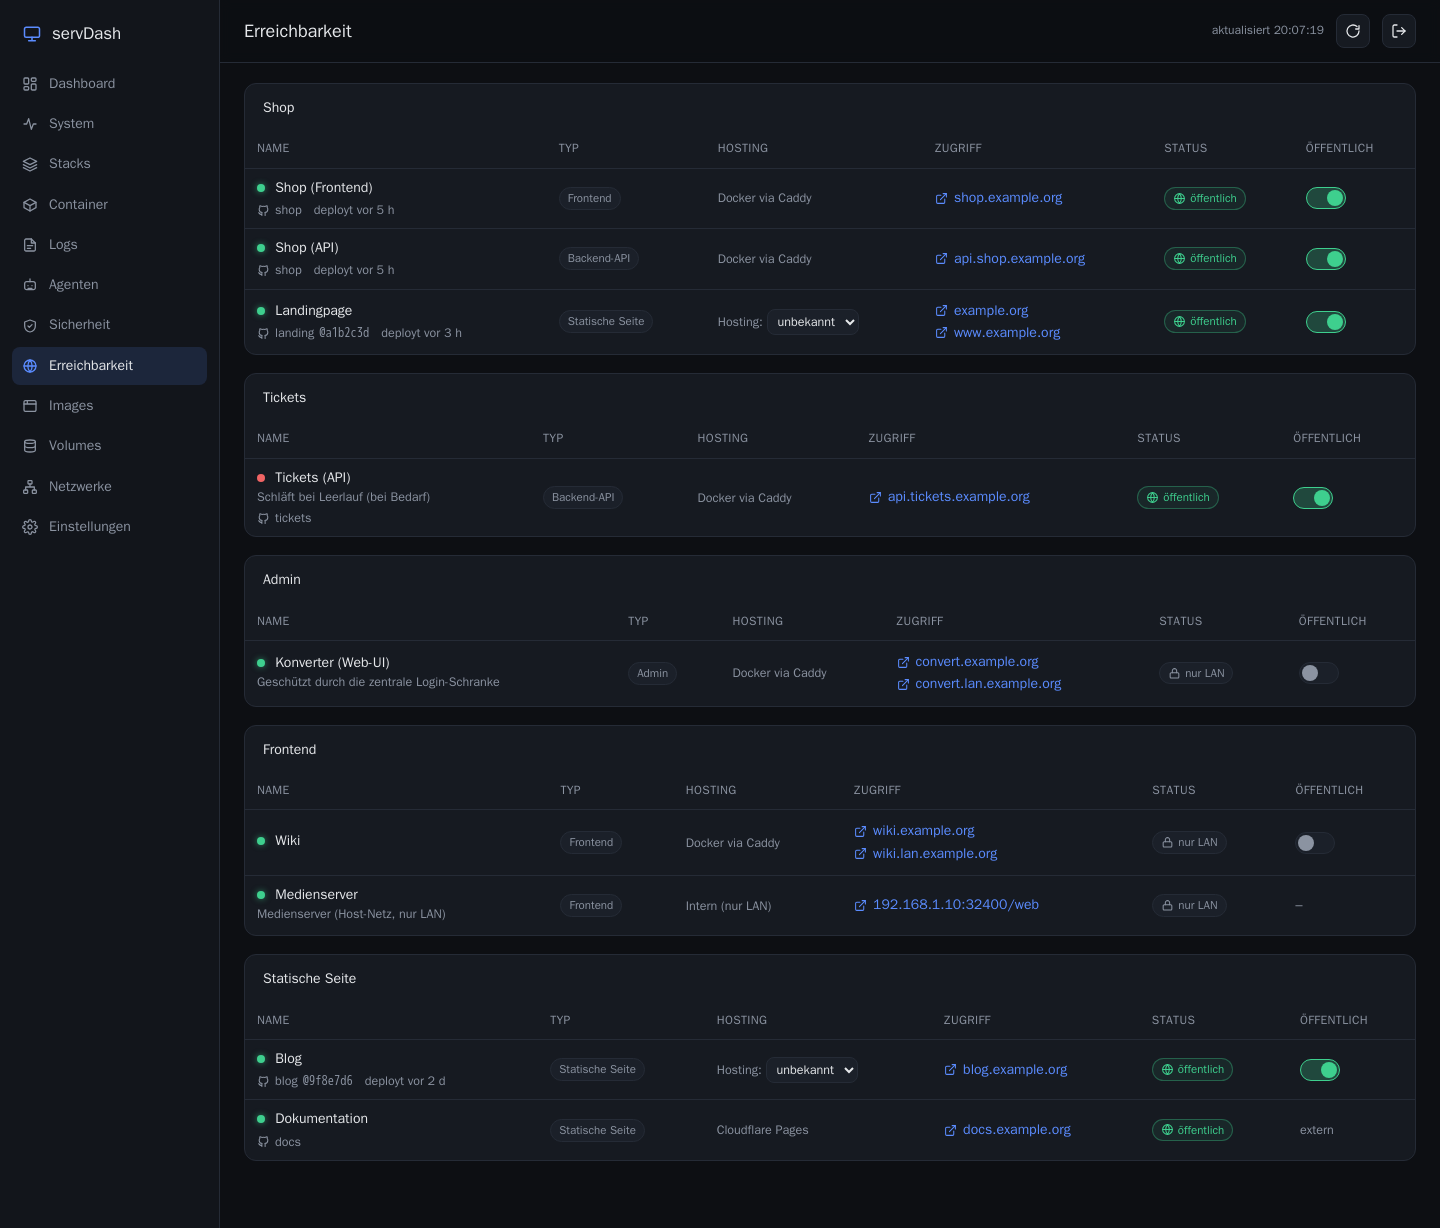
One place for “what is reachable”. Docker apps behind the reverse proxy, static sites, external sites, internal services — each with type, whether it is public or LAN-only, how to reach it, the repo and the last deploy. Public/private is a switch; after flipping it, the dashboard polls from the outside until the new state is confirmed, instead of hoping.
Backends that sleep until needed. A multi-service backend that is used a few times a day does not need to hold memory and CPU all day. A small proxy inside the dashboard receives the requests, starts the stack if it is asleep, holds the request until the services answer, and then forwards it — no timeouts, WebSockets included. After a configurable idle time the stack goes back to sleep. I measured a cold start of about 34 seconds for five Java services; the first request simply waits that long and succeeds. Details that mattered: health checks from outside monitors don’t count as activity (and are answered by the proxy while the stack sleeps), and an activity guard keeps a stack awake while its containers are busy, even without HTTP traffic.
A login gate for apps that have no login. Some tools (a converter UI, a download client) have no authentication at all. One reverse-proxy snippet — forward_auth against the dashboard — puts them behind a single login, domain-wide, with a safe redirect back to where you came from.
Agents that read logs and chase CVEs. This is the part I like most:
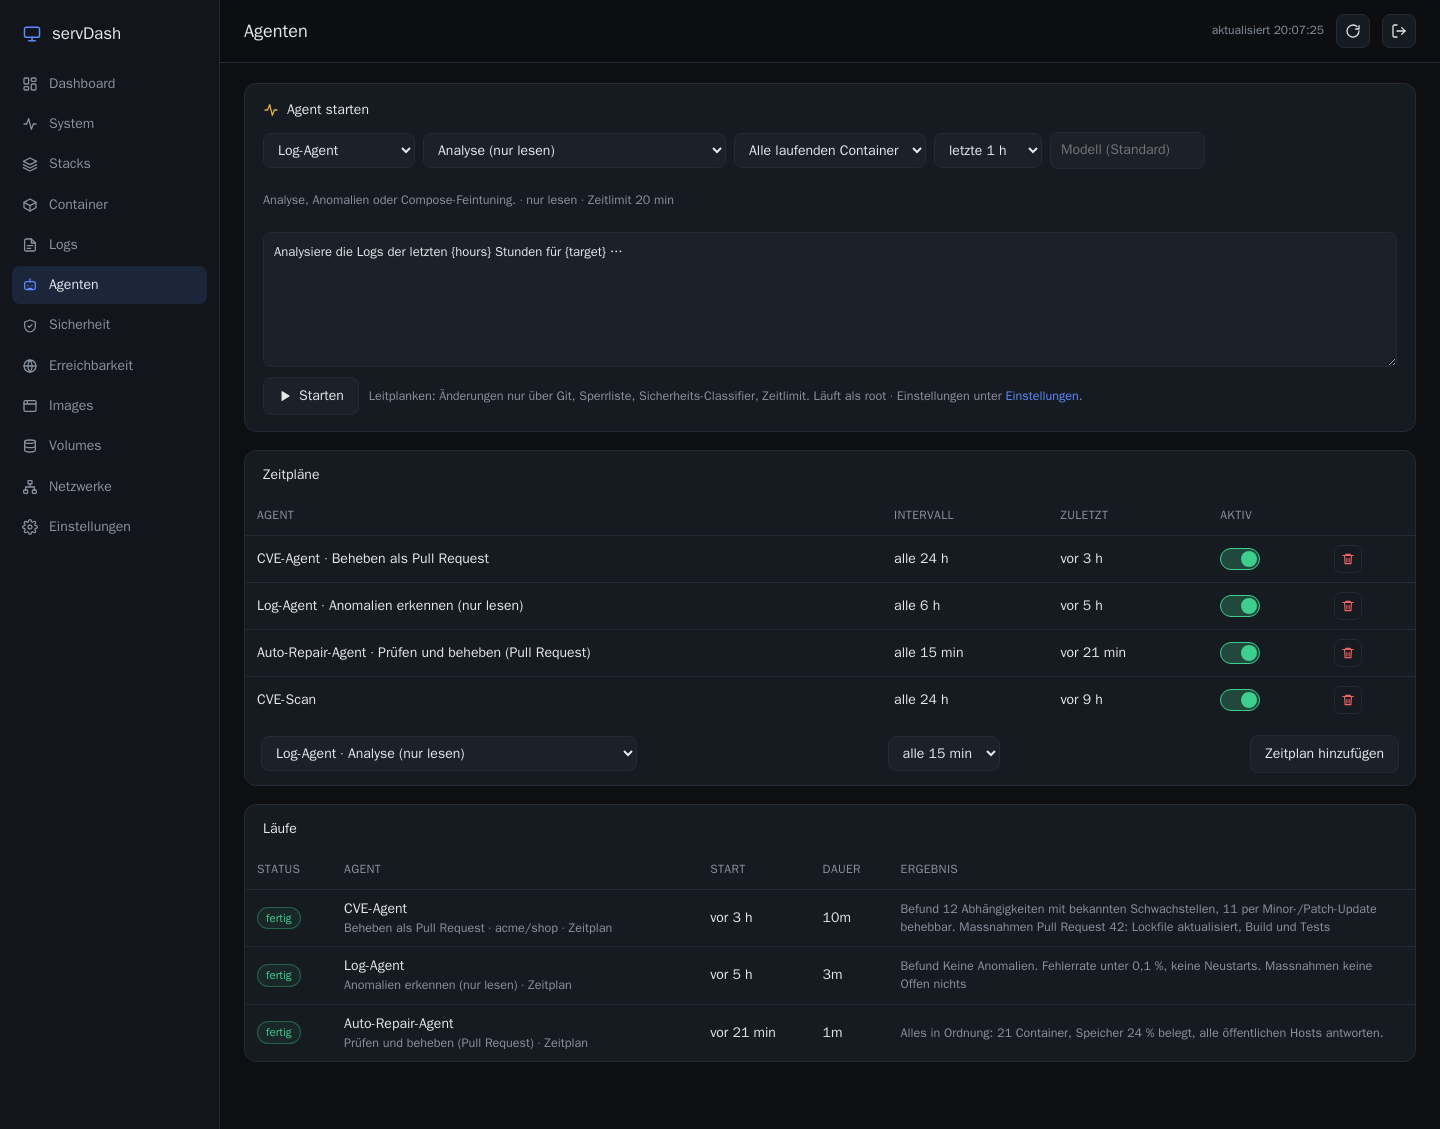
- The log agent can analyze logs, hunt for anomalies (comparing against the hours before), or tune the Docker Compose files from real measurements and propose changes as a pull request.
- The CVE agent works on Trivy scan results and has four modes: only find, triage (is the vulnerable package even used at runtime?), fix as pull request, or fix directly on the default branch after a green build. Before a mode that changes anything, it checks that GitHub is reachable and writable — otherwise the run quietly downgrades to read-only.
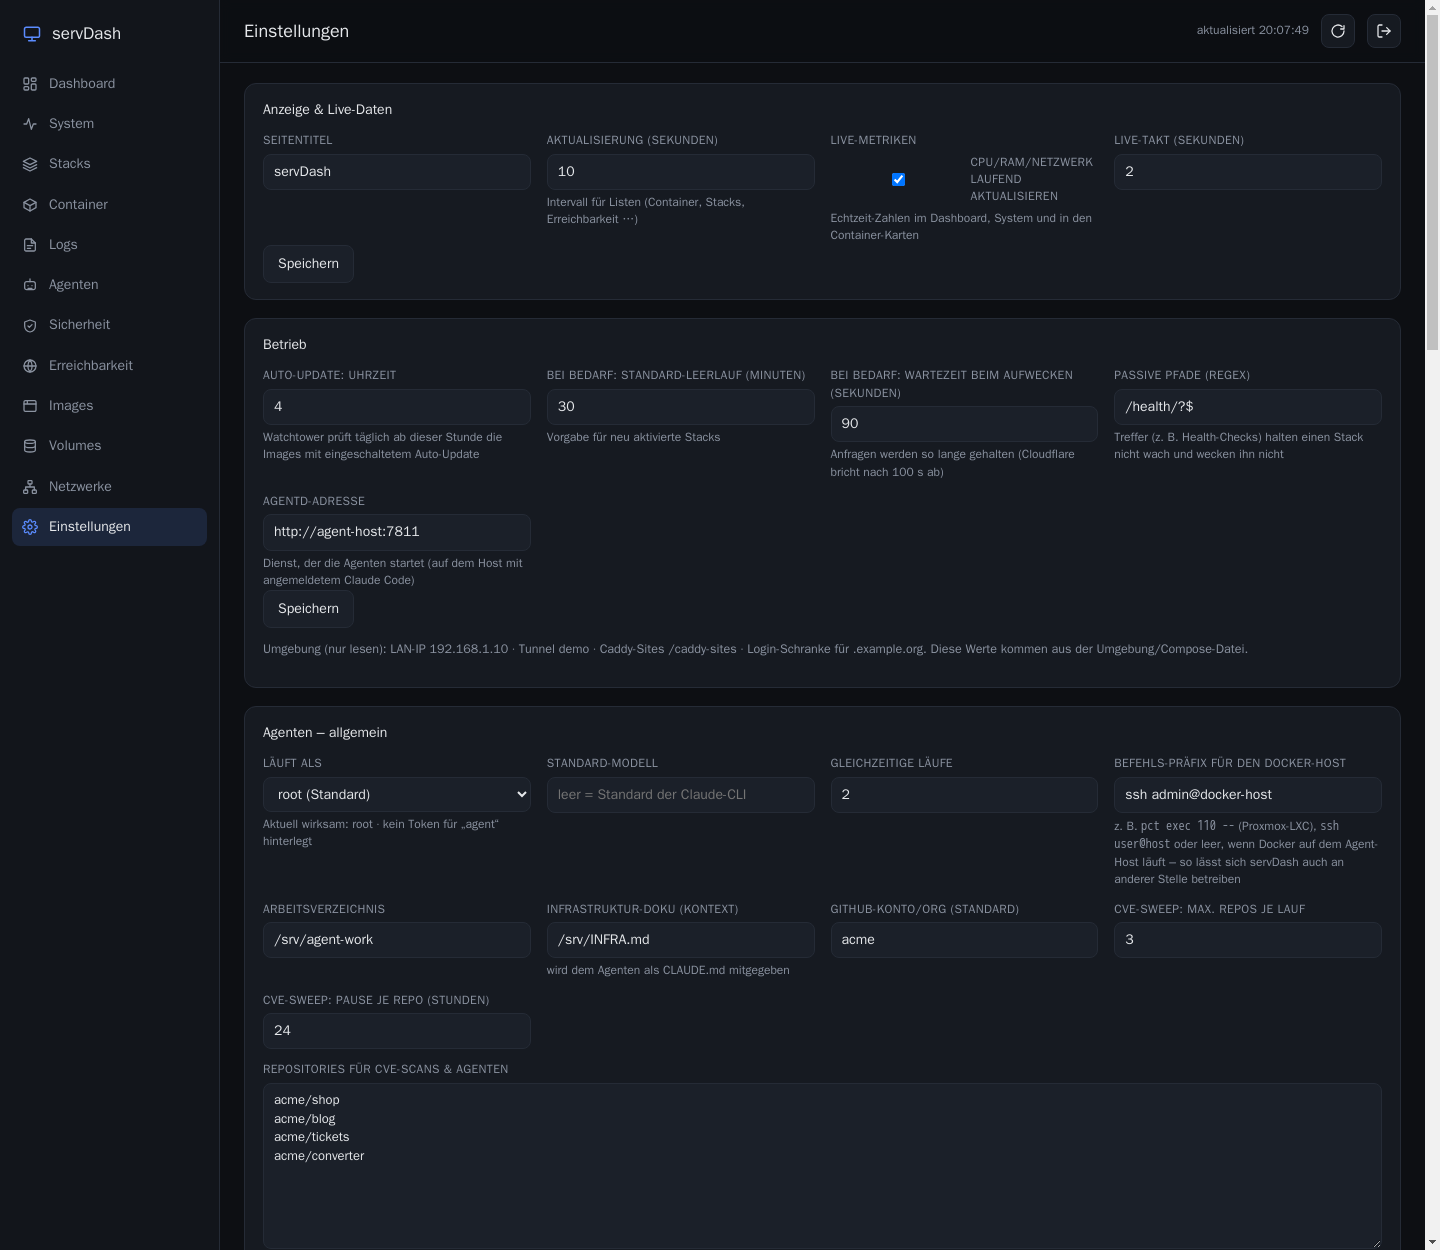
- Everything is configurable in the UI: modes, model, time limit, prompts (templates with placeholders), repositories, schedules, even the command prefix used to reach Docker — so the same setup runs on a different machine.
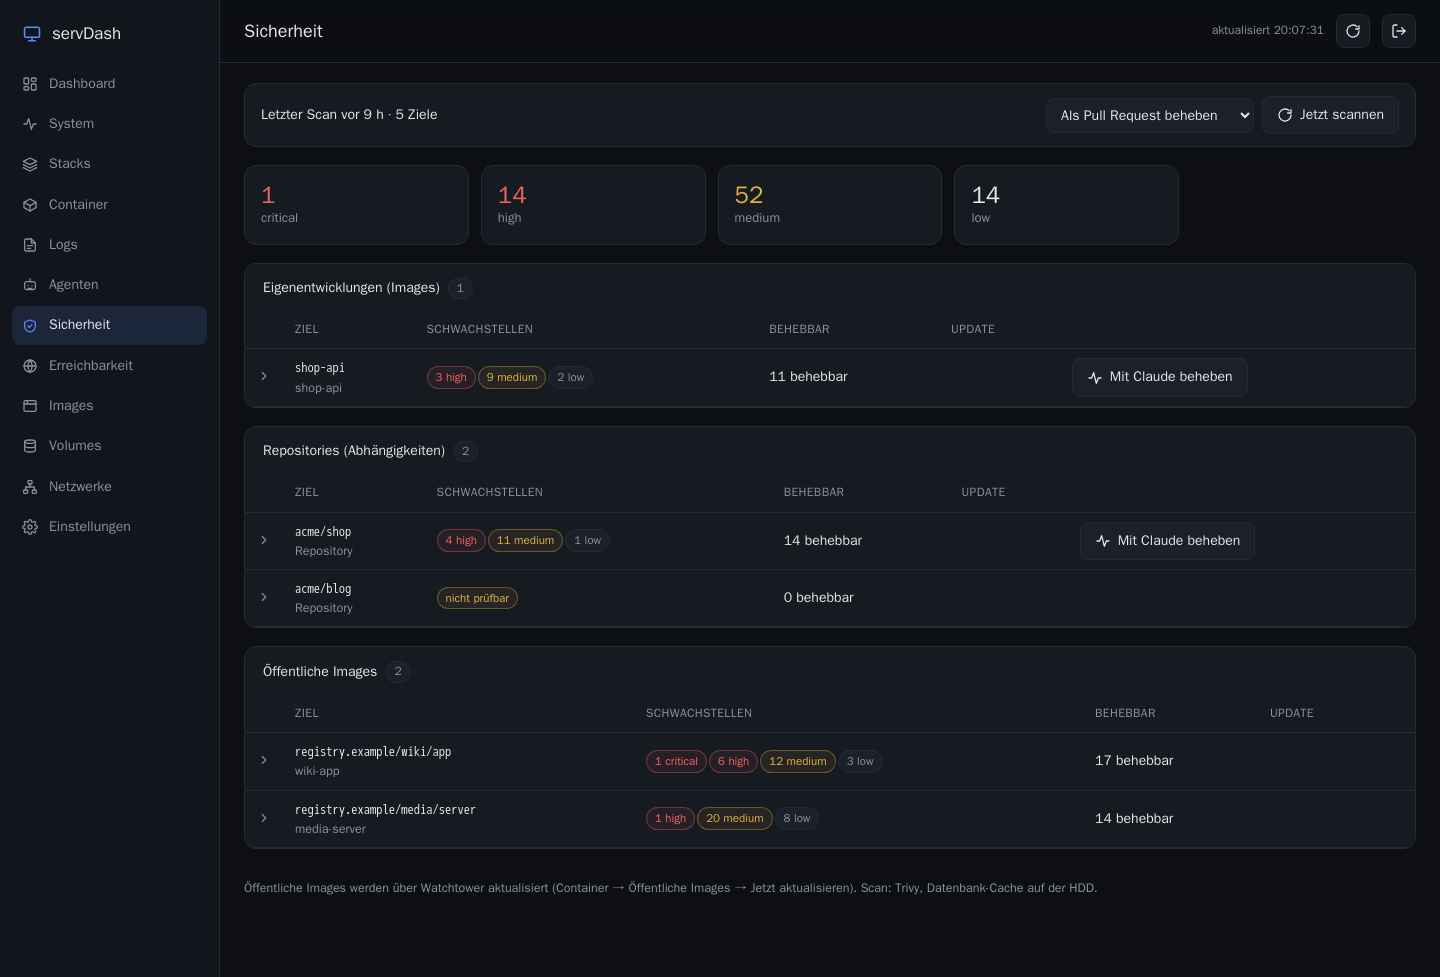
A real example of why the triage mode is worth it: on one old React site the scanner reported 79 critical and high findings, three of them critical. The agent read the code and the build setup and classified almost all of them as build or dev tooling that never ships to a browser — overall risk low — and listed the few fixes that actually matter. That is the report I would have wanted from a colleague — delivered in minutes.
(How I keep such agents inside their lane is the subject of the previous post.)
Settings for everything. Refresh intervals, live metrics, auto-update hour, sleep defaults, agent behavior — one page, no code changes.
How I worked with the AI
I barely touched an editor for the dashboard. The loop looked like this:
- Describe the outcome in plain sentences, including the annoying parts (“it must not time out while the backend starts”), and let the AI write a short spec into the repo’s
AGENTS.mdfirst. - Let the AI build in small steps — commit, push, deploy by CI, then verify live: log in with
curl, call the new endpoints, check the response shape, run the tests. “It compiles” never counted as done. - Use parallel agents for independent work. For the larger session behind this post I ran six sub-agents at once — storage and migrations, CVE fixes, the reverse proxy, the blog structure, hosting switches, a media pipeline — each with the same briefing file (the rules: everything through Git, no secrets in output, verify before reporting) and its own area of the code.
- Keep a single source of truth for context: an
AGENTS.mdthat every agent loads. It is boring and it is the reason the agents don’t re-discover the same lessons.
What went wrong (and what I learned)
- The dashboard said “public” for something that was private. The status was derived from which folder a config file sits in — and a deploy from Git quietly put the file back. The fix: the truth is the tunnel rule, i.e. what is actually reachable, not what a file says. Derive state from reality.
- “The dashboard is slow” was not the dashboard. Three video conversions and several parallel builds had saturated a single slow hard disk (a disk benchmark showed about 8 durable writes per second versus 444 on the SSD). Fixes: databases on the SSD, heavy jobs serialized with a lock, CPU caps for the converter, and stale-while-revalidate caching with background warm-up so the UI never waits for an expensive query.
- Moving the container storage while containers were running left them writing to the old, deleted path. Uploads failed for about an hour; the log agent surfaced the symptom, and the cause turned out to be my own storage move. Lesson: after a migration, test with a write, not an
ls. - Even screenshots took a detour. Headless Chrome’s
--screenshotproduced blank pages for a page with a live event stream; driving the browser over its DevTools protocol fixed it — and gave better, full-height images as a bonus.
Things worth stealing
- No database. JSON files next to the container are enough for settings and sleep state, and make the thing trivial to move.
- Git is the source of truth for configuration; reality is the source of truth for state.
- Measure cheaply. Read what the kernel already counts.
- Degrade gracefully. If GitHub is down, the agent still reports; if the tunnel API is unreachable, the status says “unknown” instead of lying.
- Use the AI for the verification, not just the code. The most valuable agent runs were the ones that checked other work.
The dashboard is not open source (yet), and it is very much shaped around my own setup. But the pieces — cgroup-based metrics, a request-holding wake proxy, a forward_auth gate, mode-based agents with a GitHub pre-check — are small enough to build yourself in an afternoon. Today, I was reminded how short “an afternoon” has become.
