What's New in My Self-Built Dashboard: Bilingual UI, Safer Agents, Auto-Scans
A day after I built my own Portainer with agents, the dashboard has already changed a lot. Using a tool every day is the fastest way to find what is missing, and most of what follows came from small irritations: a browser dialog that asked too little, a scan result that was quietly out of date, a screenshot I could not share. This post is the follow-up: what is new, why, and what I learned. As before, all screenshots come from a demo mode with invented data. The names in them are made up.
1. A bilingual interface
The UI now switches between German and English with a toggle in the header (top right in every screenshot).
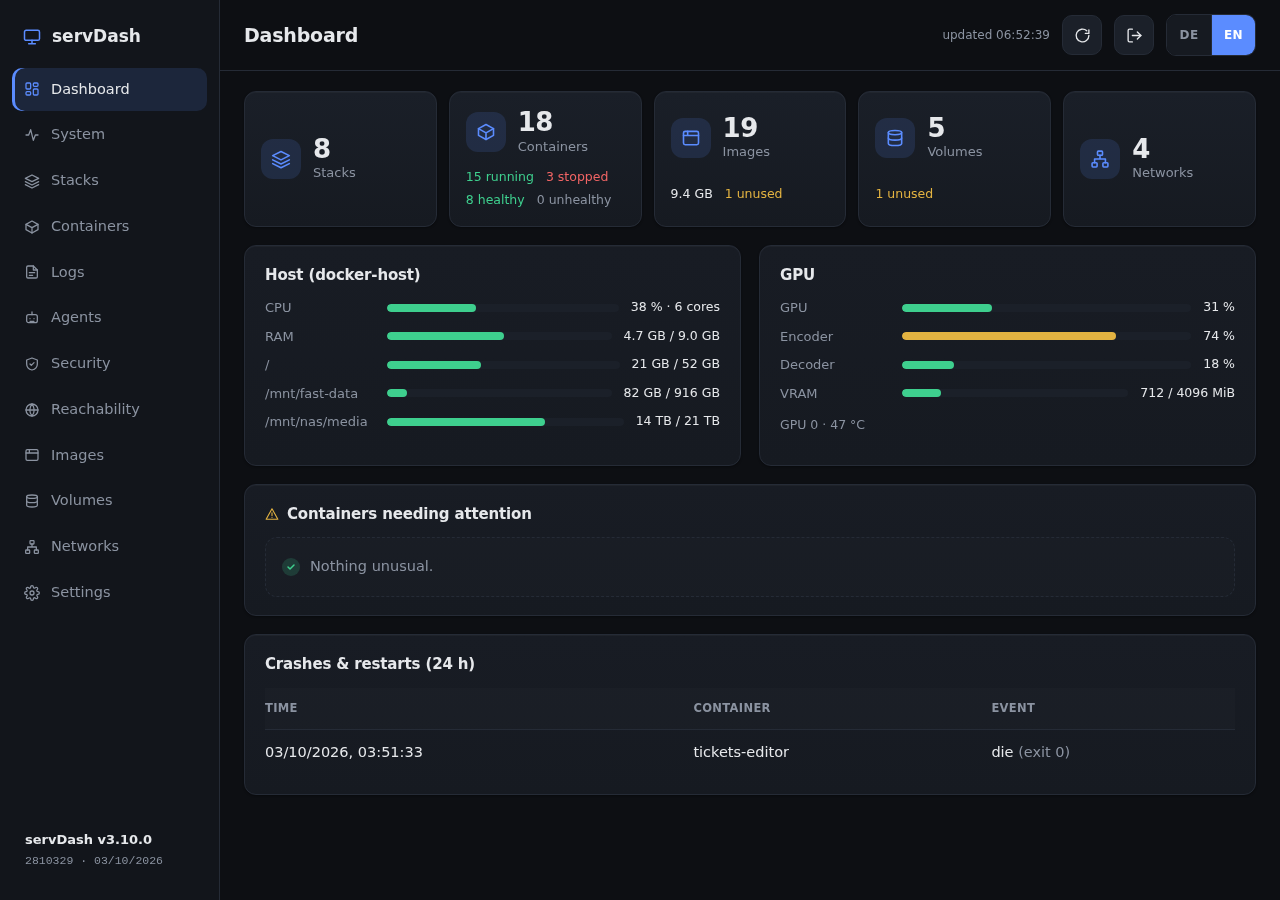
I did this without an i18n framework. There is one dictionary of keys per language and a lookup helper. The part that matters is a test: it walks through every key used in the code and fails if one language has a key the other lacks, or if a key is used but defined nowhere. A missing translation is a silent bug, because nothing crashes and you only see it when you happen to switch language. A test that compares the two dictionaries costs almost nothing and catches exactly that.
Dates and numbers follow the language too (4,7 GB versus 4.7 GB).
2. Descriptions and one-shot containers
A dashboard that lists 18 containers should say what they are for. A container can now carry a Compose label:
labels:
  servdash.description: "Converts uploaded files in the background"
  servdash.oneshot: "true"
The description is shown in the UI. The second label matters more than it looks. Some containers are meant to run, finish and exit: a migration, an index build, a job that a scheduler starts. Without more information, the dashboard sees exited and paints it red, as in the demo below. In the “Containers needing attention” list that is noise, and noise teaches you to ignore the list. With oneshot, an exit with code 0 is expected and not reported as a problem. An exit with a non-zero code still is.
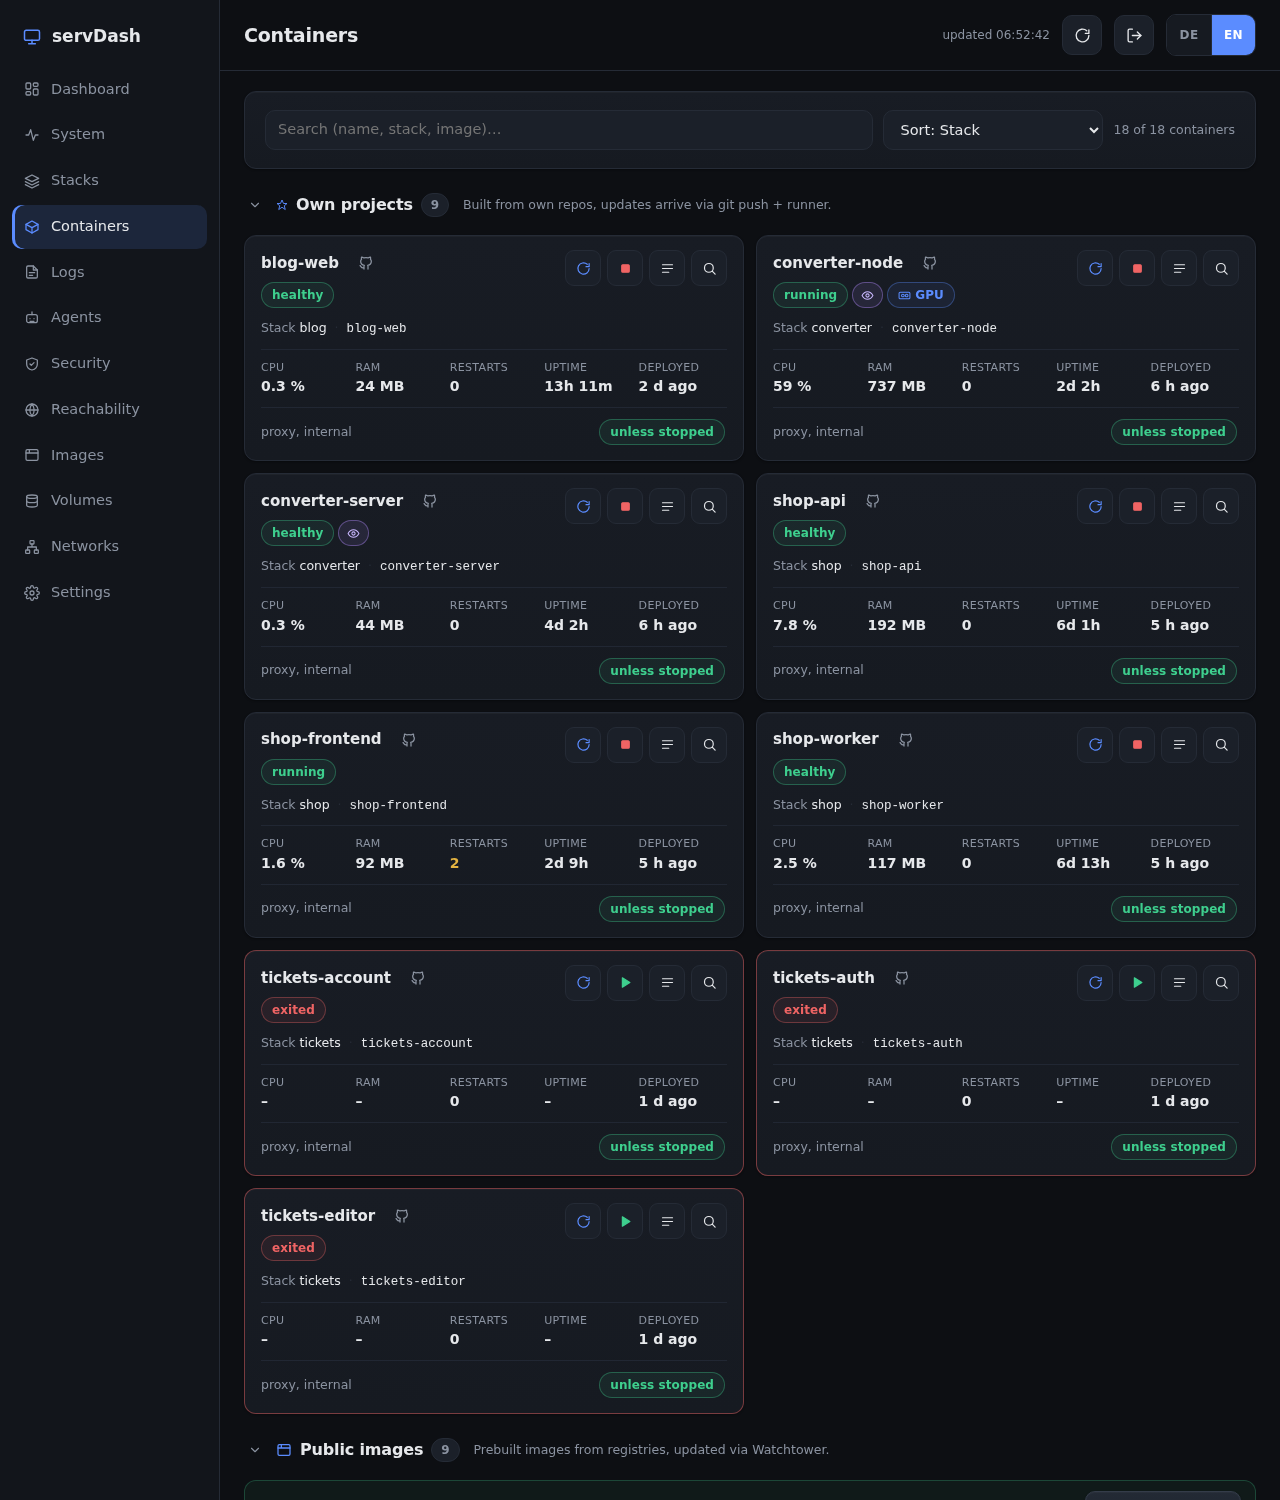
To be honest about this screenshot: the three red tickets-* containers are exactly the case the label is for. If they are batch jobs, you mark them and the red goes away. If they are services, red is correct.
3. A real dialog instead of confirm()
Starting an agent used to be a browser confirm(): OK or Cancel. That is too little for something that may change code. The new dialog asks for what matters:
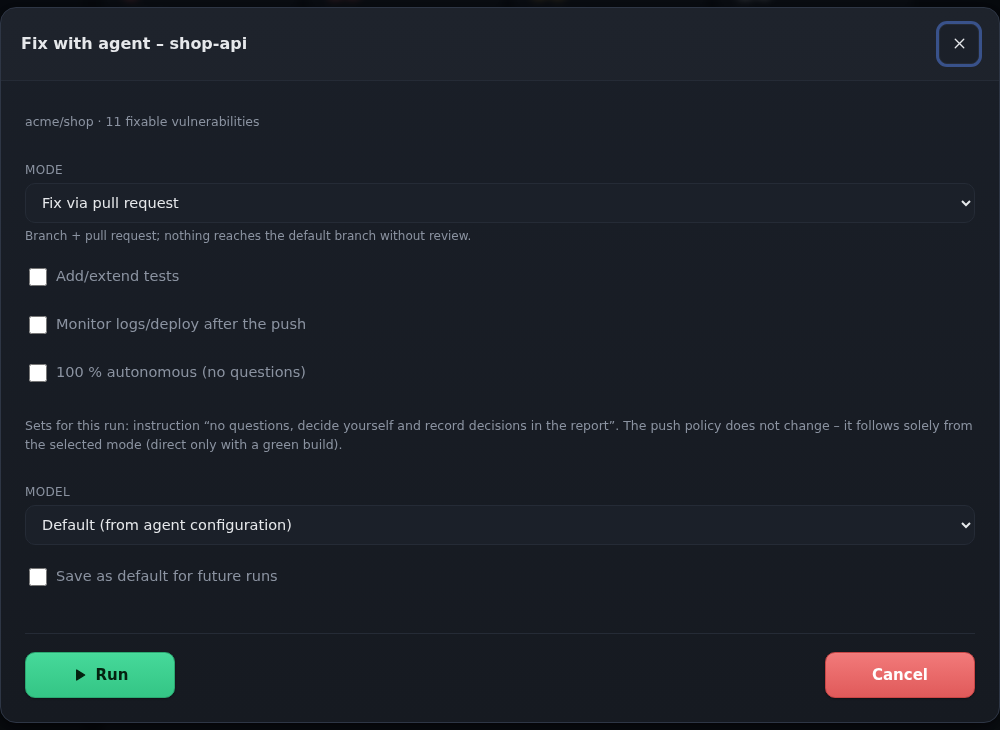
- Mode: report only, triage, fix as a pull request, or fix directly on the default branch.
- Checkboxes: add or extend tests, watch logs and deployment after the push.
- 100 % autonomous: the agent gets the instruction not to ask questions, to decide itself and to record its decisions in the report.
- Model, and save as default for future runs.
The line under “autonomous” is the important one: it does not change the push policy. Autonomy only decides whether the agent may ask questions. Whether it may push to the default branch follows solely from the chosen mode. And the “direct” mode stays tied to two conditions, which I described in the SemVer post: the build must be green, and the change must be a minor or patch update. A major version bump is a breaking change by definition, so it always goes through a pull request. I want an agent that works without supervision, but I do not want one that can talk itself into pushing a major upgrade because nobody was there to ask.
4. The “Check” step for agents
Agents are configured by prompts and by what they are allowed to run. Both are easy to get wrong, so there is now a Check button next to an agent’s configuration. It asks a model to review the setup and returns four things:
- A rating of the prompt: is it clear, does it contain contradictions, are stop conditions missing?
- A model recommendation with cost: is the task worth the large model, or is a cheaper one enough? The cost is an estimate, shown as an estimate.
- A list of the commands the agent will probably use, each with a risk level.
- A proposed
allowedToolslist, the allowlist of commands the agent may run without asking.
Nothing is applied automatically. A proposal becomes active only after I click “Apply”. I think this is the right split: the model is good at noticing that a prompt allows rm -rf somewhere, and I am the one who decides whether that is acceptable. A suggestion that changes permissions on its own would defeat the purpose of the exercise.
5. Hidden mode for screenshots, demos and streams
Triple-click the logo and the dashboard enters hidden mode. Anything flagged as sensitive disappears from the lists, and a small crossed-out eye next to the logo shows that it is on. Compare the two security screenshots: the first has 7 targets, the second 6, because one flagged target is simply not there.
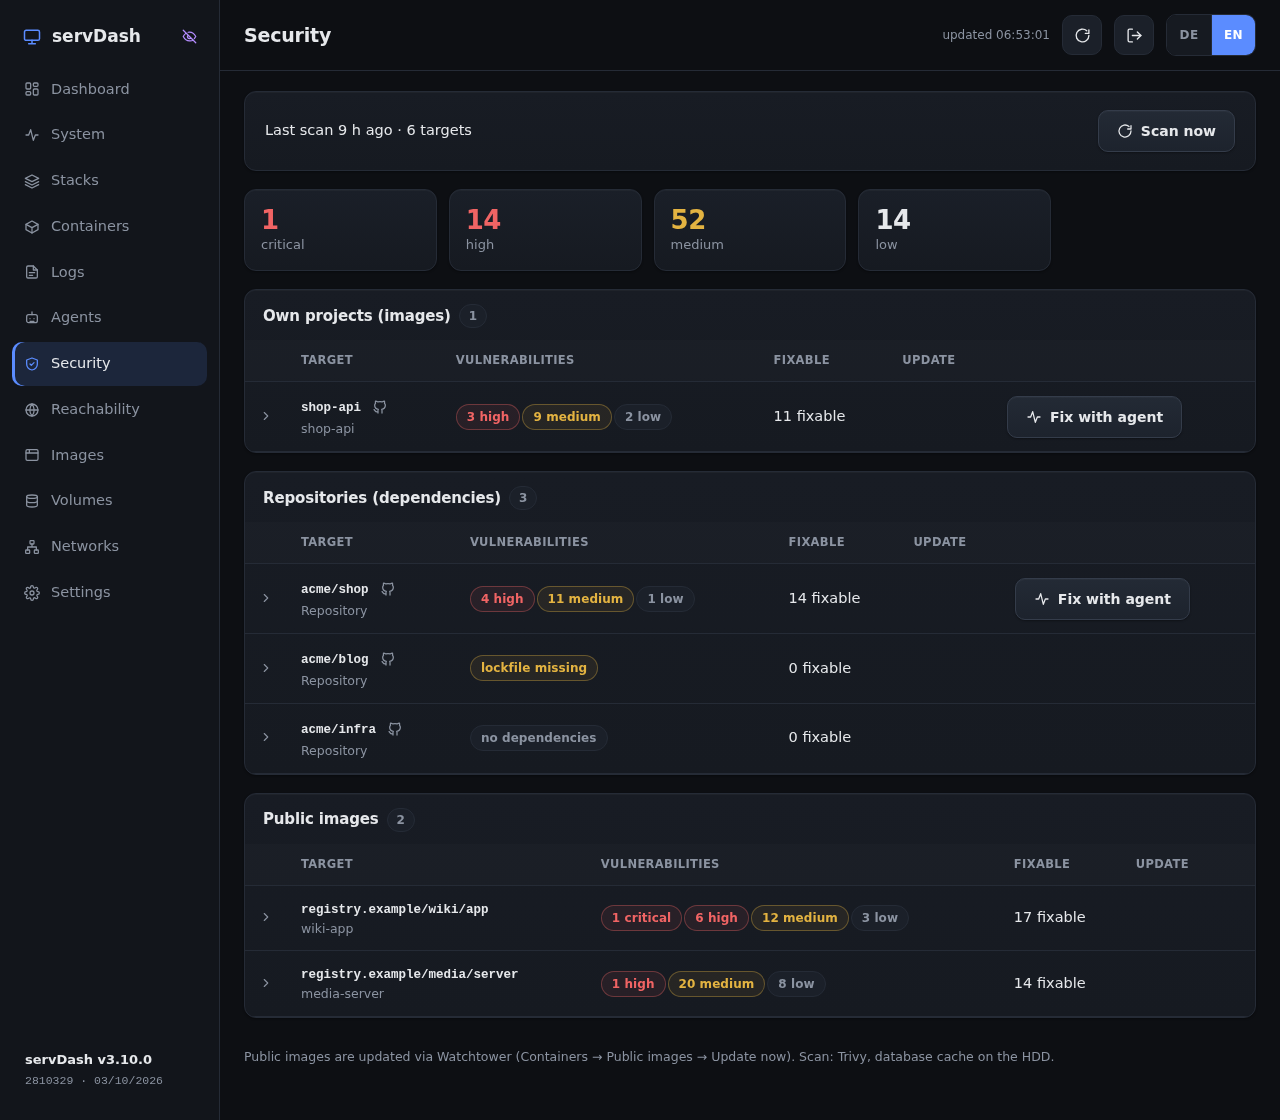
Hidden mode is there so I can show the dashboard to someone, record a stream or take screenshots without checking each row first. It is a convenience for the audience in the room, not a security feature. The login still decides who can see anything at all.
6. Auto-scan on new images, and why the daily scan is not enough
Until now, the CVE scan ran once a night. That sounds reasonable, until you look at what happened: I deployed several images after the scan, and the dashboard still showed the old state. The numbers were not wrong, they were out of date, and a security overview that shows yesterday’s picture gives false comfort exactly after you have changed something.
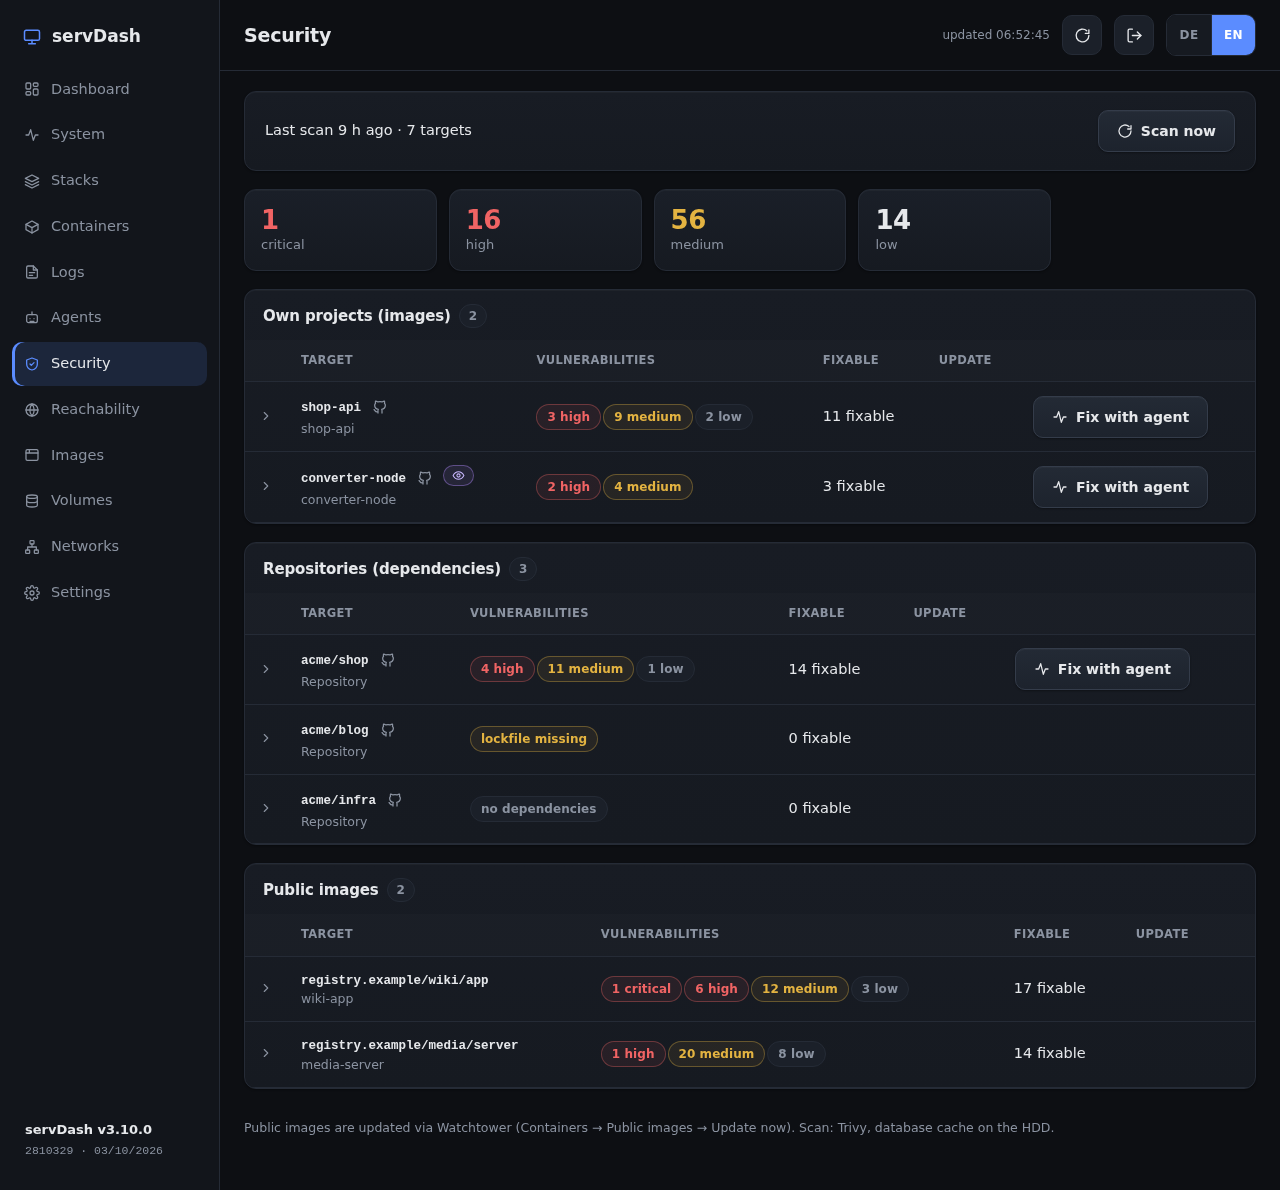
Now the dashboard listens to Docker events. When an image is created or a container is started from a new image, a scan is scheduled. Three details make that work in practice:
- Debouncing: a deployment of five services produces a burst of events. The scan waits until it is quiet for a short while and then runs once.
- A queue: scans are heavy, and the host does not like parallel heavy work. Requests are queued and run one after another.
- The nightly scan stays. Events cover changes I make. They do not cover new vulnerabilities being published for an image that has not changed. That is what the daily run is for.
7. A blind spot in frontend findings
A smaller finding with a real consequence: scanning a built image of a frontend tells you very little. The bundle in the image contains compiled JavaScript but no package.json or lock file, so there are no manifests for the scanner to read. The result looks clean and is just empty. This is why the overview scans repositories as well (the “Repositories (dependencies)” table), and why a repository without a committed lock file is shown as “lockfile missing” instead of “0 findings”. An honest “cannot check” is better than a green zero.
8. A version in the sidebar
At the bottom of the sidebar the dashboard shows its own version, a short commit hash and the date. It follows SemVer, in the spirit of the post linked above. It sounds minor, but when I look at a screenshot or a bug report, I want to know in one second which build it came from.
9. What is next (planned, not built)
These are plans, and none of them exists yet:
- Backups and snapshots, including restoring a server image from the dashboard.
- Database backup and restore per table, so that I can bring back one table without rolling back the whole database.
Restoring is the dangerous direction, so I expect it to need the same care as the agents: a preview of what will be overwritten, an explicit confirmation, and a rollback path.
Lessons learned
- A missing translation is a silent bug. A key test between the language files is cheap and catches it.
- “Exited” is not always an error. If a tool cannot tell a finished job from a crash, the alert list becomes noise.
- Autonomy and permission are different knobs. “Do not ask me” must not mean “you may push anything.”
- Let the model suggest, let the human apply. Especially for permission lists.
- A security overview must say how fresh it is. Trigger scans on change, and keep the periodic scan for what changes outside.
- An empty result can mean “not checked.” Show that difference.
- Build the demo mode early. It made every screenshot in this post possible without exposing anything real.
